
TL;DR: Express’s router now publishes a
TracingChannel(express.router.request) for every middleware, route handler androuter.param()callback. APMs, loggers and your own code can observe Express without patching.
How Express has been observed until now
Observability for Express and similar frameworks relied on one aspect of JavaScript, called monkey patching. Monkey patching is the ability to replace the API exposed by a library with a different one. For observability purposes, the replacement is a wrapper that calls the original but attaches telemetry signals or “checkpoints” around its execution.
These are signals like when an API got called and when it finished, or whether it errored out. Observability tools collect these signals for you, and present them in one way or another.
APM (Application Performance Monitoring) tools usually patch some of Express’s API, like the endpoint handlers app.get/post/... and app.use for middlewares. Patching requires knowledge of how these APIs work, and may break if a new release changes how a certain API works.
Here is a quick example of patching the app.use method:
const originalUse = app.use;
app.use = function (...args) {  const wrapped = args.map((arg) => (typeof arg === 'function' ? wrapHandler(arg) : arg));
  return originalUse.apply(this, wrapped);};
This may look simple, but it is critical that wrapHandler preserves the signature of the user’s handler. For example, error handlers use 4 arguments, so if the wrapper only accepts 3, you may end up breaking all of your users’ global error handlers.
Another limitation is that to patch an Express app, you need the app itself. That makes it harder to build an experience where everything “just works”, which is what’s called “auto instrumentation”. Without it, users need to pass along their Express apps, resulting in APIs that look like this:
const express = require('express');const apm = require('some-apm');
const app = express();
apm.instrumentExpress(app);
To get rid of that step, APMs patch the module instead via module hooks. This is roughly what require-in-the-middle does, and import-in-the-middle does the same for ESM using loader hooks, or more recently, the module.registerHooks API. But that creates two new problems…
First, the instrumentation must load before Express (e.g. node --import ./instrument.js app.js), otherwise it misses the import window.
Second, more platforms, frameworks and tools now bundle server-side code. express may be inlined into your app bundle, so it never gets imported and never triggers these module hooks.
Users running their own observability code are in the same boat. They need to be aware of the APIs and how to patch them properly in the first place.
One alternative is to bring in an open standard like OpenTelemetry to do all of this for you, but it uses the same strategies we discussed so far, so it is prone to the same issues.
This makes it clear that libraries and frameworks need a low-level runtime API, one that allows these libraries to own their own observability, and also allows:
- Libraries to announce what they are doing in their own terms, as events.
- Subscribers to hook into those events and turn them into telemetry signals.
This sounds a lot like an event emitter, but that’s not good enough.
Why not event emitters
The problems with emitters are:
- They usually introduce overhead to the observed operations. Even with no listeners, the library still builds the event payload on every call and looks up the channel-subscriber maps.
- You need the emitter instance to listen to it, so “auto instrumentation” is still blocked.
- If a listener throws, it shows up as an error from your library rather than the subscriber.
Then there is context propagation. When an operation’s end event is emitted, how do we know which operation it was?
One of the most common telemetry signals is spans, which tell how long an operation took. In our case, how long a request took to respond. With many requests coming in, we need to know how to correlate starts with ends to produce the signals we need. We need a correlation context, and APMs did that by keeping track of requests, mapping them to IDs and stitching them together by hand.
A bad trace looks like this:
In Node we have AsyncLocalStorage (ALS), which lets you set a value that follows your code across async boundaries.
Anything that runs inside als.run(store, fn), even after an await or a timer, gets the same store back from als.getStore(). So we need an event emitter that builds on top of that, and is optimized for extremely low overhead.
const { AsyncLocalStorage } = require('node:async_hooks');
const als = new AsyncLocalStorage();
async function handle() {  await new Promise((resolve) => setTimeout(resolve, Math.random() * 100));  console.log(als.getStore()); // still the request that started it}
// two requests in flight at once, their awaits interleaveals.run({ requestId: 1 }, handle);als.run({ requestId: 2 }, handle);
// { requestId: 2 }// { requestId: 1 }   order varies, but each sees its own id
Finally, we also need an API that represents the lifecycle of an operation. An operation can be synchronous or asynchronous, and it can error out.
There is an API that does all of this: the TracingChannel API of the node:diagnostics_channel module.
Tracing channels
Tracing Channels were first introduced in Node 19.9 and backported to 18.19, and they’re built on top of diagnostics_channel. A tracing channel is essentially 5 diagnostic channels in a trench coat.
The 5 channels describe the execution lifecycle of an operation, and cover the different shapes of APIs we deal with in JavaScript: sync, callback and promise-based:
start: the operation is about to run.end: the operation returned synchronously.asyncStart: the callback was called or the promise settled.asyncEnd: the callback or promise continuation finished.error: the operation threw, rejected, or passed an error to its callback.
Tracing channels also correlate the async context automatically. Every event out of the five mentioned gets the same context object, and that context can be stored in an AsyncLocalStorage during the operation. So APMs and users can easily tell which operation is executing right now and match the ends with their starts without worrying about mixing them up.
On the library side, publishing is a matter of wrapping the operation:
const dc = require('node:diagnostics_channel');
const queryChannel = dc.tracingChannel('my-db:query');
function query(sql) {  return queryChannel.tracePromise(() => runQuery(sql), { sql });}
And anyone can subscribe to the library’s tracing channel from anywhere, without having to import the library at all.
const dc = require('node:diagnostics_channel');
dc.tracingChannel('my-db:query').subscribe({  start(ctx) {    ctx.startedAt = performance.now();  },  asyncEnd(ctx) {    console.log(ctx.sql, performance.now() - ctx.startedAt);  },});
What about overhead? Publishing to a channel with no subscribers is close to free, and libraries can even skip allocating context objects by checking if there is a subscriber.
The Express tracing channel
Express now has an express.router.request channel which fires for every middleware, route handler, and param callback, so users and APMs can subscribe and produce the signals they need. Here is a quick logging example:
const dc = require('node:diagnostics_channel');
dc.tracingChannel('express.router.request').subscribe({  start({ req, route, handler }) {    console.log(`${req.method} ${req.baseUrl}${route} -> ${handler.name || '<anonymous>'}`);  },  error({ handler, error }) {    console.error(`${handler.name || '<anonymous>'} failed:`, error);  },});
Each event gets a context object with the following properties:
| Field | Description |
|---|---|
req, res | The request and response objects. |
route | The matched path pattern, like /users/:id, not the concrete /users/42. |
handler | The middleware, route handler, or param callback being invoked. |
param | The parameter name, only for router.param() callbacks. |
error | The error the handler reported, by calling next(err), throwing or rejecting. |
incomingError | The error an error handler received. |
errorHandler | true when the handler is an error handling middleware. |
result | What the handler returned, or what its promise resolved to. |
What can you do with this
Here are a few things you can build with a handful of lines and no dependencies.
Measuring latency
Log every request with its route pattern instead of the raw URL, so /users/1 and /users/2 end up in the same bucket:
const dc = require('node:diagnostics_channel');
const routes = new WeakMap();
dc.tracingChannel('express.router.request').start.subscribe(({ req, res, route, errorHandler }) => {  if (errorHandler) return;
  if (!routes.has(req)) {    const startedAt = performance.now();    res.once('finish', () => {      const ms = (performance.now() - startedAt).toFixed(1);      console.log(`${req.method} ${routes.get(req)} ${res.statusCode} ${ms}ms`);    });  }
  routes.set(req, req.baseUrl + route); // the last one to start handled the request});
This could be represented as metrics with the various APM and telemetry tools.
Logging errors
Since errors are only reported where they originate, you can log exactly which middleware or handler to blame:
dc.tracingChannel('express.router.request').subscribe({  error({ req, route, handler, error }) {    console.error(      `${req.method} ${req.baseUrl}${route} failed in ${handler.name || '<anonymous>'}:`,      error.message    );  },});
// GET /orders/:id failed in loadOrder: connection refused
Performance monitoring with spans
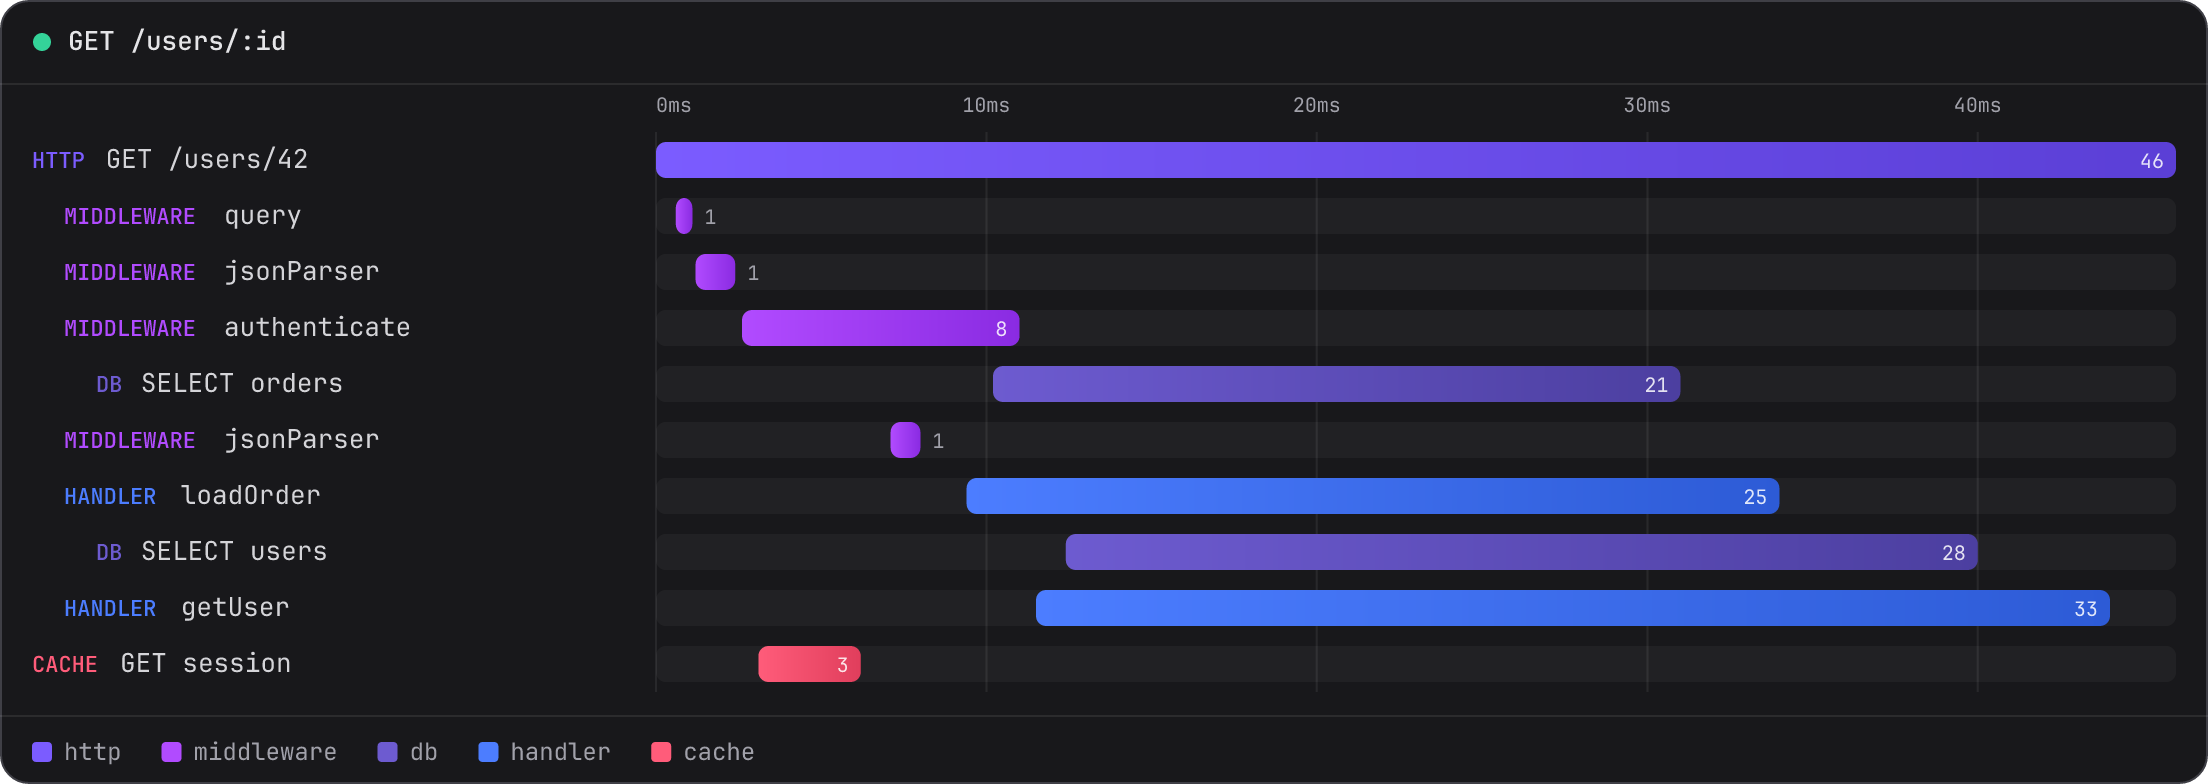
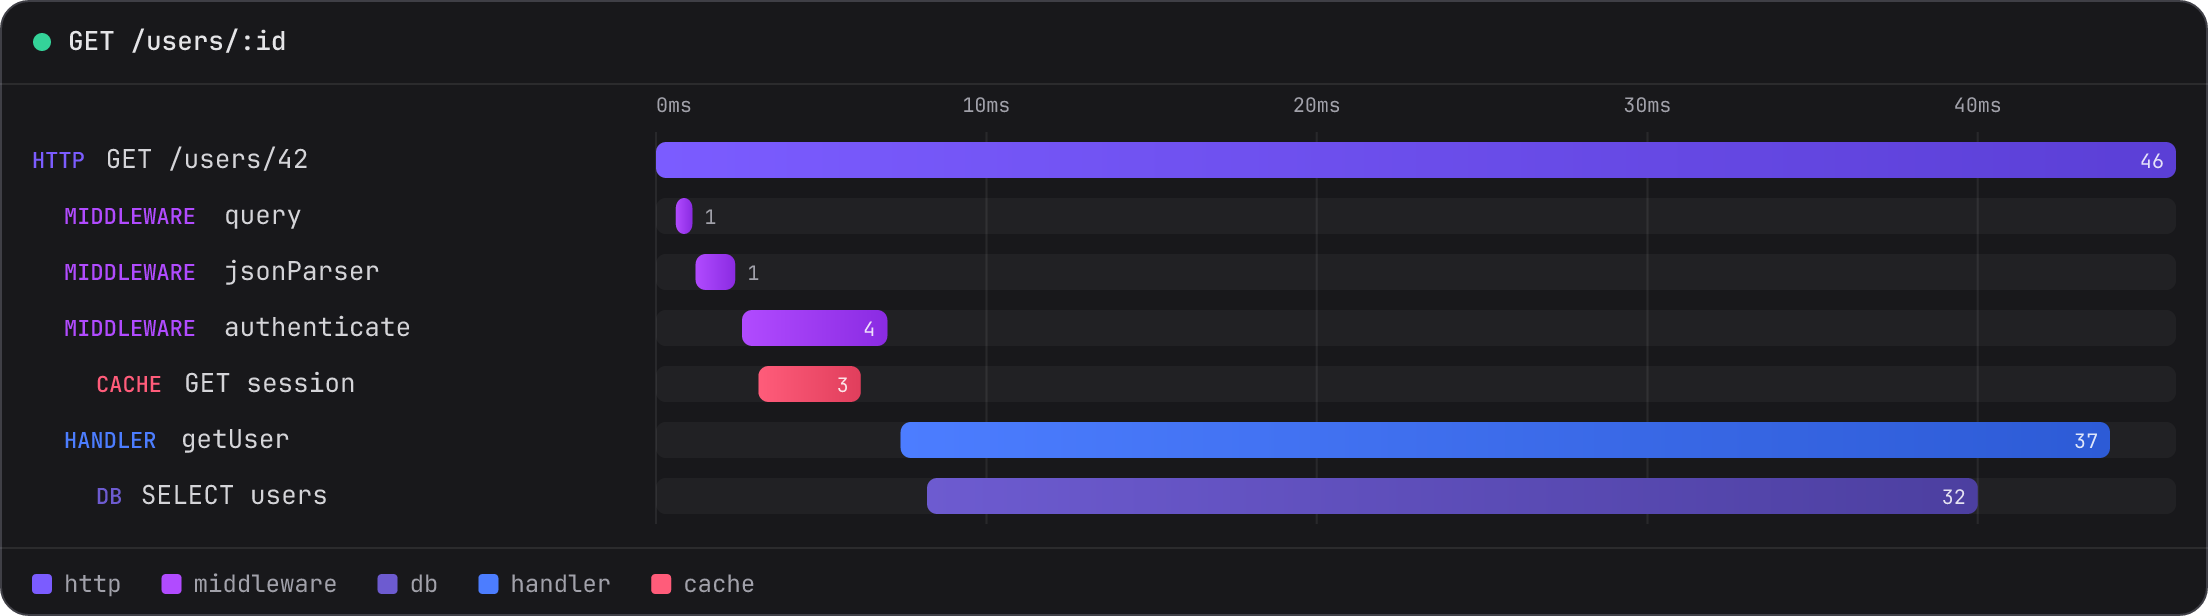
OTel’s HTTP instrumentation already creates a span for the request, so you only need to start a span on start and end it when the handler finishes:
const dc = require('node:diagnostics_channel');const { context, trace, SpanStatusCode } = require('@opentelemetry/api');
const tracer = trace.getTracer('express');const parents = new WeakMap();
dc.tracingChannel('express.router.request').subscribe({  start(ctx) {    // every handler hangs off the request, otherwise middleware nest like stairs    if (!parents.has(ctx.req)) parents.set(ctx.req, context.active());    const parent = parents.get(ctx.req);
    ctx.span = tracer.startSpan(ctx.handler.name || '<anonymous>', {}, parent);    ctx.token = context.attach(trace.setSpan(parent, ctx.span)); // active while the handler runs  },  end(ctx) {    ctx.token.dispose();    if ('result' in ctx || 'error' in ctx) ctx.span.end();  },  asyncEnd(ctx) {    ctx.span.end();  },  error(ctx) {    ctx.span.recordException(ctx.error);    ctx.span.setStatus({ code: SpanStatusCode.ERROR });  },});
With every span tied to the request it belongs to, the same GET /users/:id request from earlier now looks like this:
What this means for the ecosystem
Several libraries and frameworks in the ecosystem have started shipping their own tracing channels, like mysql2, node-redis, ioredis, graphql, mongoose, and Nitro’s ecosystem. Express joins them, and this means it now brings its own instrumentation instead of waiting for someone to patch it.
For APMs, this eliminates module hijacking, load order requirements, and special ESM handling, and decouples the router internals from its observers, because the channel and its context are the contract.
For you, it means your Express app is observable whether or not you use an APM, and the same few lines work no matter how your app is built or bundled. And with the ecosystem moving towards the same model, each library and framework brings its own piece to the picture.
If you maintain a library or a middleware, we’d love to see you publish your own channels. The cost is a few lines, and the payoff is that every tool in the ecosystem can understand what your code is doing.
Try it
Tracing channels ship in router v2.3.0, the package that powers Express 5’s routing. Every Express 5 app already depends on it, so there is no Express upgrade needed. Just make sure your lockfile picks up the new version.
You need Node 18.19 or later. Older versions simply don’t publish anything. The full list of events and context fields is in the router’s Diagnostics docs.
If you want the full story behind the initiative and why we landed on this design, I covered it in my talk at NodeConf EU.
Thanks to everyone who helped ship this, especially Sebastian Beltran, Stephen Belanger, Gerhard Stöbich, Ulises Gascón and Wes Todd for the reviews and fixes that went into it.